Each year since 2013, Jisc Collections has asked UK institutions to submit data on their article processing charges (APCs). Last year, we published an analysis of APCs and subscription costs in the UK for the years 2013-2015.
Since then,
- RCUK committed to extending their block grant until 2020;
- Jisc Collections and the sector renewed agreements with and IOP Publishing;
- And open access costs continued to grow around the world for those funding via the gold route.
What has changed in the way we pay APCs? This post will provide a brief update on what has (and hasn’t) changed in the most recent year’s data.[1]
Open access continues to grow
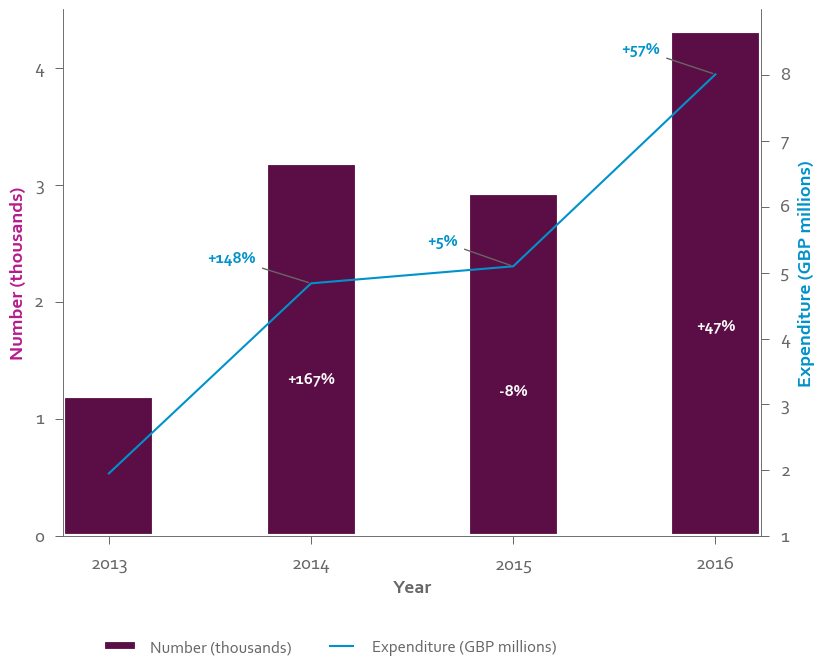
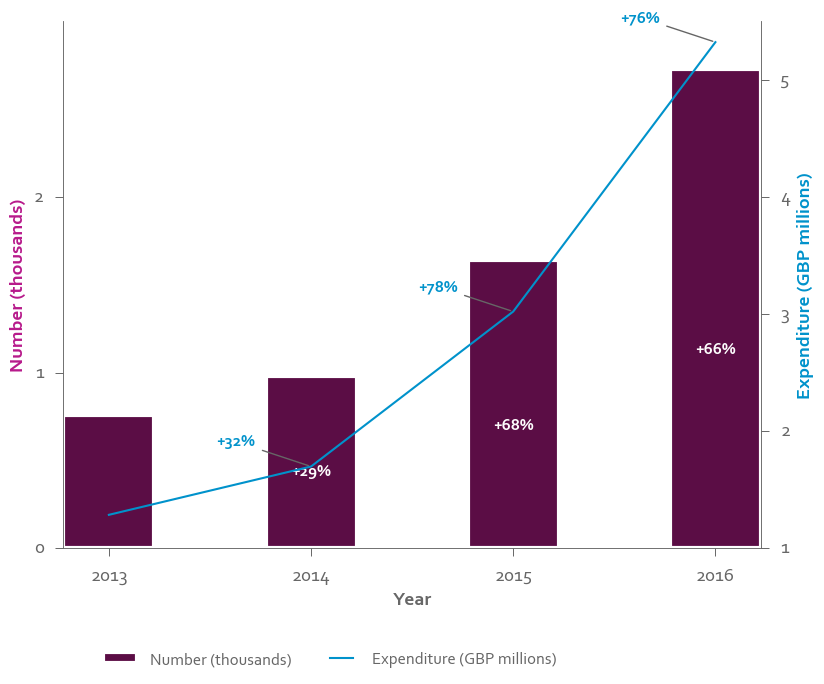
This year, like last year, the number of APCs paid increased dramatically. Expenditure increased even faster due to the continued increase in APC prices.
Last year we hypothesized that the spurt of growth stemming from the introduction of the RCUK block grant mid-2013 would begin to slow now that the budget had been in place for several years. This does not appear to be the case, as the number of APCs has increased by more than half since the previous year. The strong growth becomes even more apparent when we remove one outlier, a research institution with a large open access budget who reduced their APC spending significantly in 2015 and therefore account for the dip in this year.
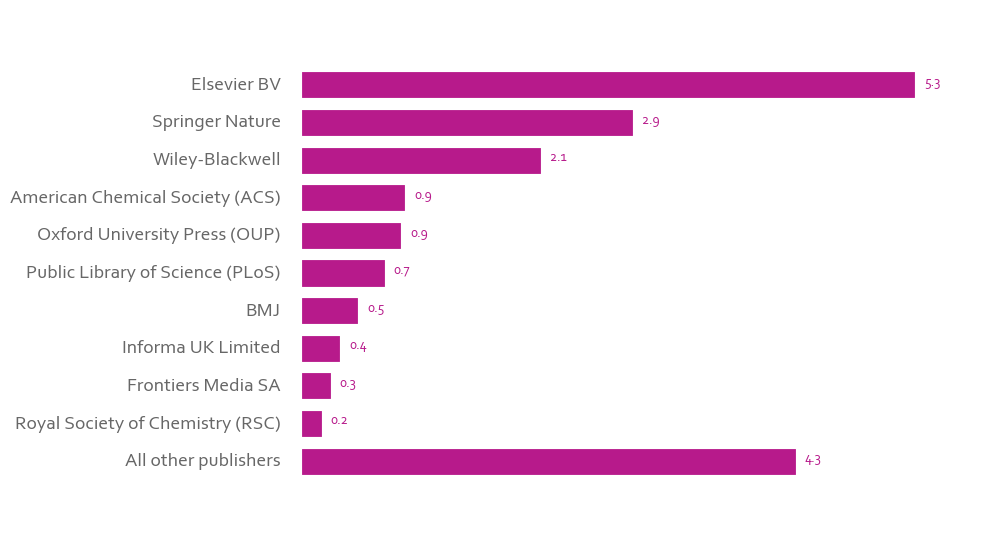
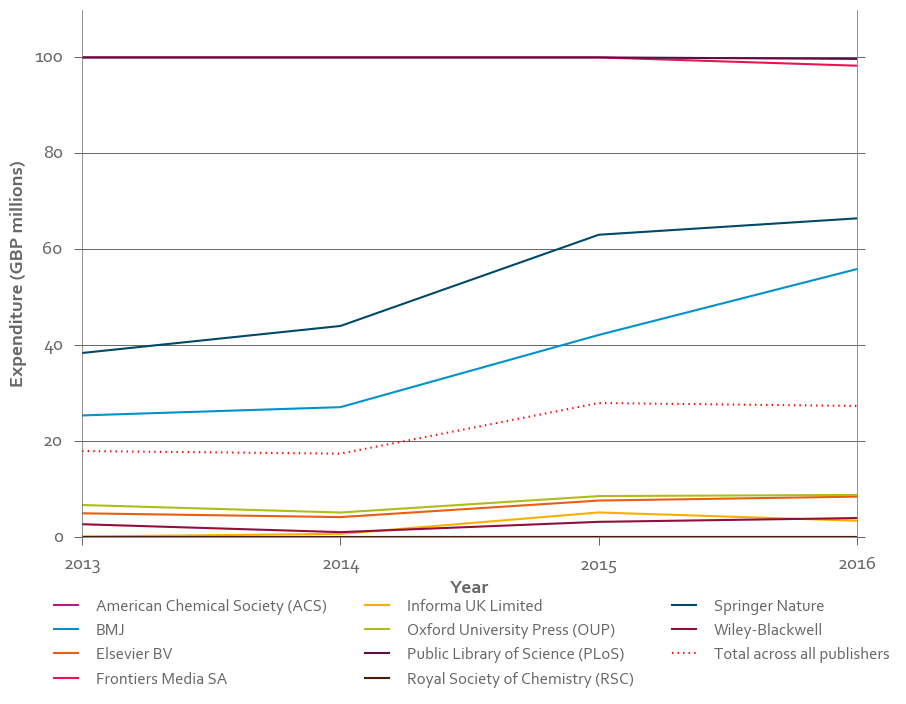
Like last year, the majority of APC expenditure from institutions in Jisc APC is being spent on publishing with a small handful of publishers. The top 10 publishers make up 77% of spend, and the remaining 525 publishers in the dataset comprise the long tail. Elsevier continues to dominate, taking nearly a third of APC revenue. However, Springer Nature, following the merger of Springer and Nature Publishing Group, is now a significant competitor, particularly when offset APCs are included, as discussed below.
Offsetting deals are an increasingly important part of the open access landscape
Institutions are paying for an increasing number of APCs through discount, membership, and pre-payment schemes. Specifically, ‘offsetting agreements’ link subscription and APC payments, seeking to reduce subscription costs while APC payments grow. Offsetting arrangements implemented so far differ in their design: some reduce the cost of individual article processing charges, some permit unlimited publishing for a capped amount, and others provide a refund or publishing credit.
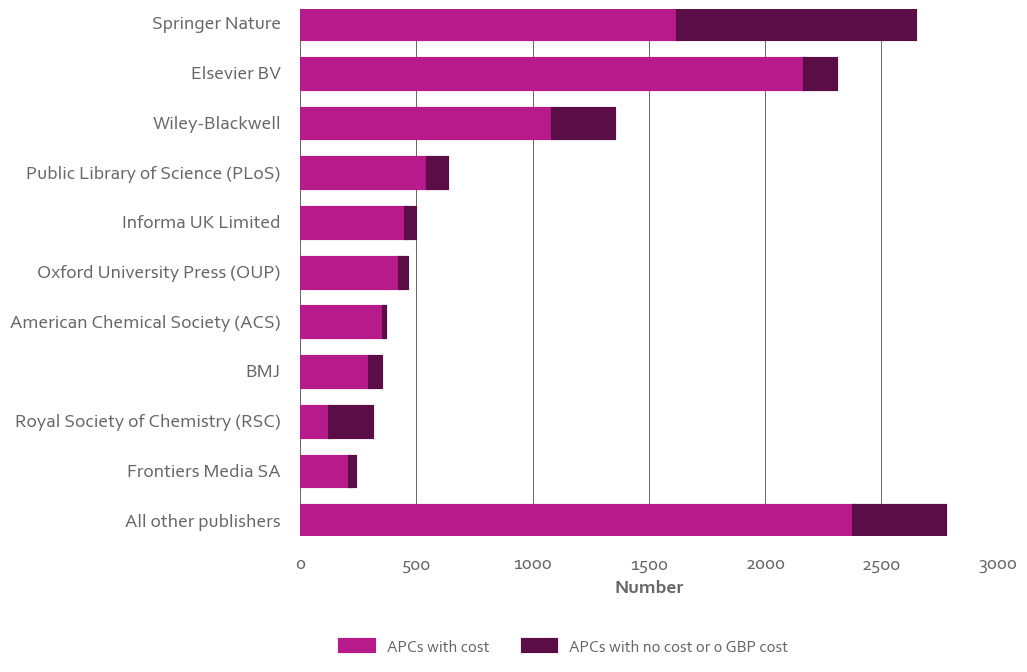
With the latter, institutions usually pay an amount up front in exchange for a discount or voucher on APCs paid throughout the year or in the following year. It’s difficult to establish the true cost of these , so most institutions record these APCs at £0 or with a blank value. Of the 11,914 APCs we collected data for, a full 2,220 had their value marked at £0 or left blank. Some of these APCs are genuinely free (because the fee was waived, for example) but it is difficult to estimate how many. We have observed a big difference in the distribution of £0 or null APCs by publisher: those, such as Wiley-Blackwell and Springer Nature, who have offsetting deals have a large number of £0 and null APCs.
There’s currently no way to reliably estimate the cost of offset APCs, because the APC template did not ask institutions to report how much they spent on the membership scheme overall. In this analysis, I’ve omitted £0 APCs when calculating the average APC, both for consistency with previous years and because we are only interested in APCs which have a cost associated with them. We’ve introduced a new way of recording offset APCs in the most recent release of the APC template, which should improve the quality of the data in the years to come. (For more on how institutions manage offset costs, see University of Cambridge and University of Sussex’s own analyses).
Even from the data we have, however, we can see that offsetting deals are playing a large part in keeping costs down. The average APC continues to rise by £100 a year since 2014. In the past two years, the average APC had appeared to converge towards the £1500-2000 estimate set out in the Finch report. This year, though, we can see the average price tending towards divergence again. Informa UK (the parent company of Taylor and Francis) and Royal Society of Chemistry, who both have offsetting deals in place, have seen their APC costs fall below average. Wiley-Blackwell and Springer Nature, who also offer offset deals, have kept a stable average APC. Meanwhile, Elsevier and, to a lesser extent, Oxford University Press – publishers who have no offsetting deals in place – are seeing their average APC move up quickly. American Chemical Society (ACS) offers discounts on APCs through the Author Choice Scheme. As the scheme relies on ACS membership we do not know how this translates into discounts on actual APC spend. However, like Elsevier, their average APC has risen quickly over the past four years.
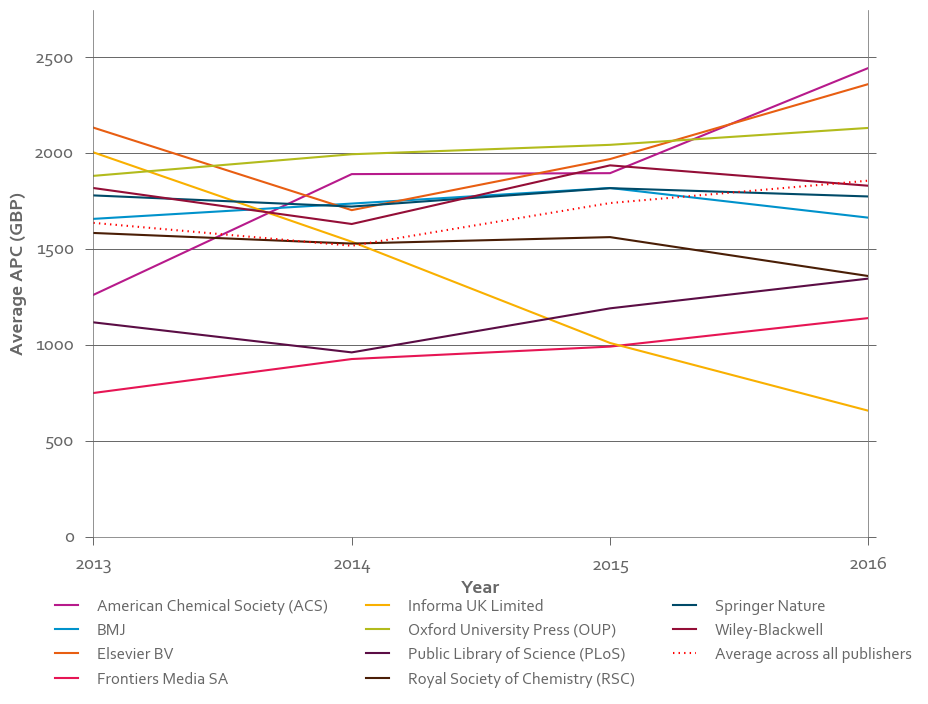
Fully open access publishers Public Library of Science and Frontiers are also seeing their average APC prices rise, although their pricing remains well below that of their competitors. This is consistent with rising prices for fully open access journals, explored in more detail below.
Fully open access journals are becoming a larger part of expenditure
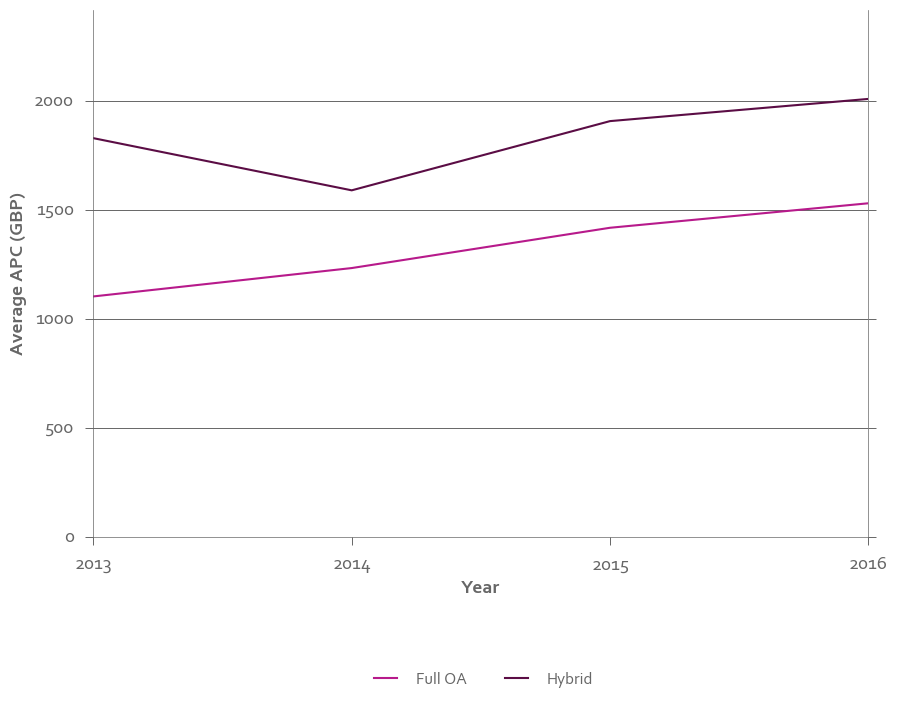
Following up on last year, expenditure on fully open access journals has been rising slightly faster than on hybrid. Fully open access journals currently make a quarter of overall expenditure, up slightly from last year. This is partly because a larger number of APCs are being paid to fully open access journals, and partly because the average APC of fully open access journals is rising slightly faster than that of hybrid. This finding is consistent with RCUK’s findings this year. The average fully open access APC remains several hundred pounds below hybrid.
Fully open access journals are becoming a larger part of publishers’ portfolios. This is consistent with recent analyses showing a growing proportion of articles being published in fully open access journals.
Putting it all together
The explosive growth of APCs paid in the past year is a promising sign for the move towards gold open access. It reflects the success of funder mandates and block grants encouraging immediate open access.
With both the number and cost of APCs rising, institutions will increasingly need to rely on offsetting deals to keep costs down. Jisc will continue to investigate the effectiveness of offsetting deals and support those that aid the community. When publishing with publishers who don’t offer offsets, institutions may find that they increasingly need to go down the green route in order to mitigate rising costs.
The costs of publishing in fully open access journals are also expected to rise slightly, as these journals bring their pricing more in line with their hybrid competitors. However, we expect fully open access APCs to remain well below those of hybrid.
As APCs become a larger part of the open access landscape, it’s more important than ever to track them in a consistent, standardized way. Jisc, together with RCUK and COAF, has released a new, simplified version of the APC spreadsheet that helps standardize the way offset APCs are recorded. Jisc Monitor Local is a software that makes it easy for institutions to track and record APCs, and Monitor UK brings APC data together at a national level to track and compare open access costs.
You can find a detailed analysis of APC spend, together with the underlying code and data, on Github. The data is also available to download on Figshare.
[1] For detailed information about how the data was cleaned and processed, and the potential issues with the data, see the detailed analysis. Note that the analysis below does not take into account changes to the exchange rate. Part of the growth in the year 2016 can be attributed to the pound’s value falling with respect to other currencies.