The IRUS team have developed a widget in response to requests from IR (institutional repository) managers who wanted to surface usage statistics more visibly in their IR and encourage open access. Using this new widget, institutions can embed IRUS-UK COUNTER-conformant statistics into their own institutional repository (IR) pages. This means it can provide them with instant, interactive and visible evidence of their download usage figures.
Features:
- Able to see COUNTER-conformant statistics in a prominent place within own IR site
- Provides a high-level snapshot of overall usage
- Ease of use and interactive usage data displayed
A widget means that the IR has the flexibility to view stats within their local IR or to use a separate application (the IRUS-UK portal) to run the Item Report 2 (IR2). Running IR2 shows the number of successful item requests by month and item type. The data displayed through the widget is exactly the same. Also, because the widget is interactive, the data will always be up-to-date and displaying the most recent monthly figures. The data in the widget can be used to show the proportion of downloads for different periods, which enables comparisons over time.
By default, the widget provides summary level download statistics for a repository, for the last 12 months, broken down by item type.
Controls within the displayed widget allow users to interact with the widget to:
- Configure the required date range
- Limit to a selected item type
- Select overall totals or a breakdown per month
- Display or hide the header table
- Display or hide summary totals
The widget in use
Aberystwyth planned working example
The University of Aberystwyth is planning to embed the widget into their Aberystwyth Research Portal repository.
A direct quote from Amy Staniforth on how they intend to use the widget:
“We plan to add the widget to our Aberystwyth Research Portal menu so that staff and readers can more easily see the growth in usage of our different collections over time. In particular, we hope that this will spark interest in usage and encourage authors of outputs to see open access as an opportunity, not just a funding requirement.”
Aberystwyth said it has been very easy to set up and they have requested that a link to it is added to their research portal https://pure.aber.ac.uk/portal/.
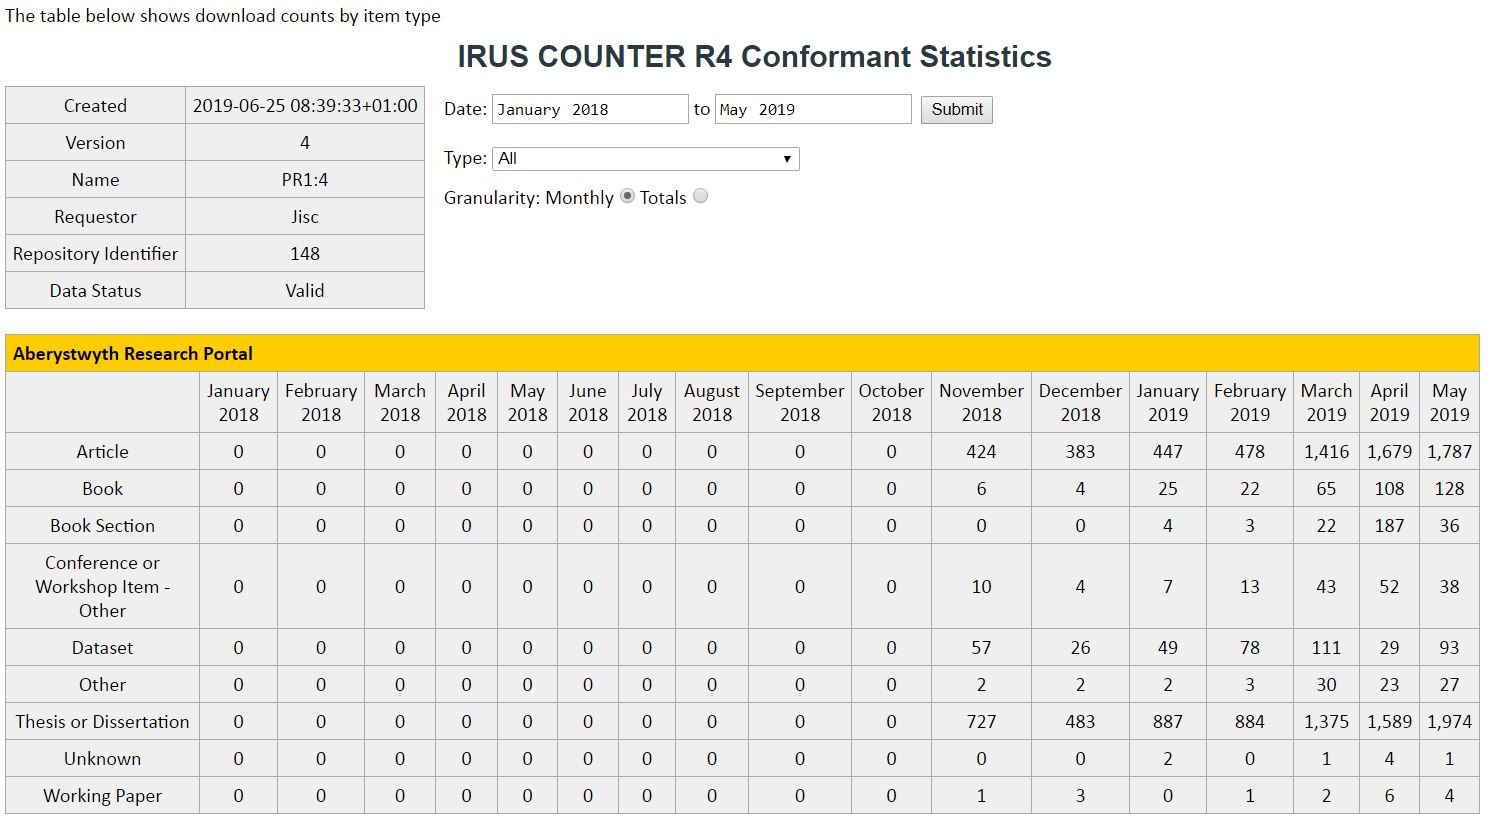
Example of how their data will be displayed by item type and by month:
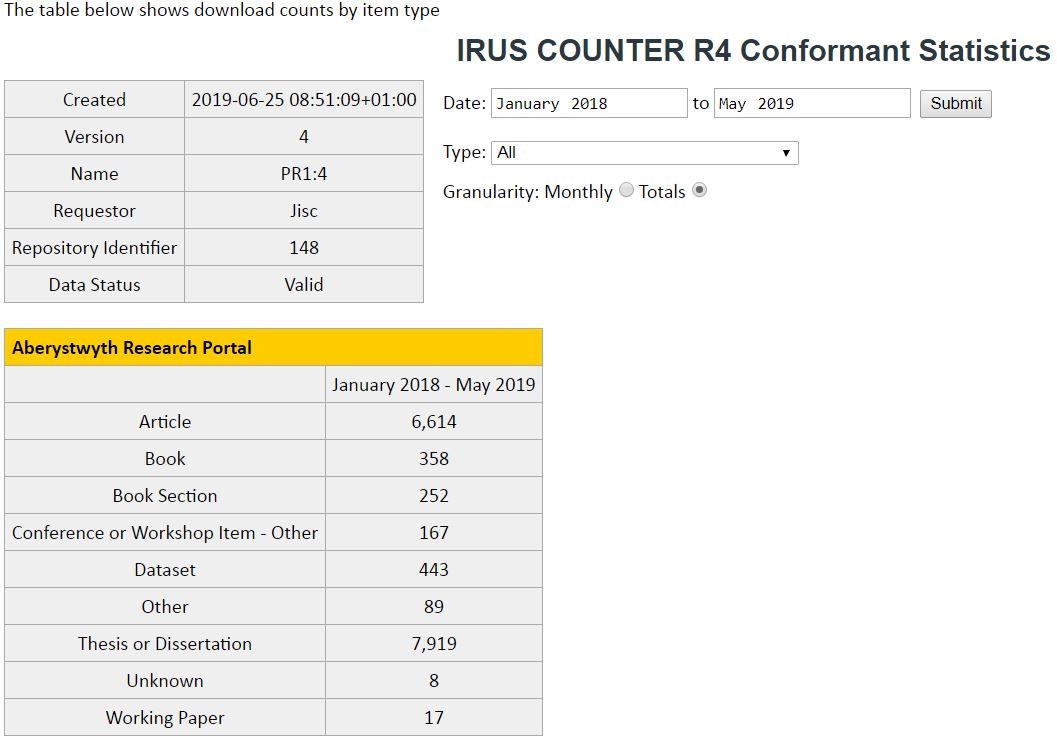
Example of how their data will be displayed by totals during the selected period:
Cambridge working example
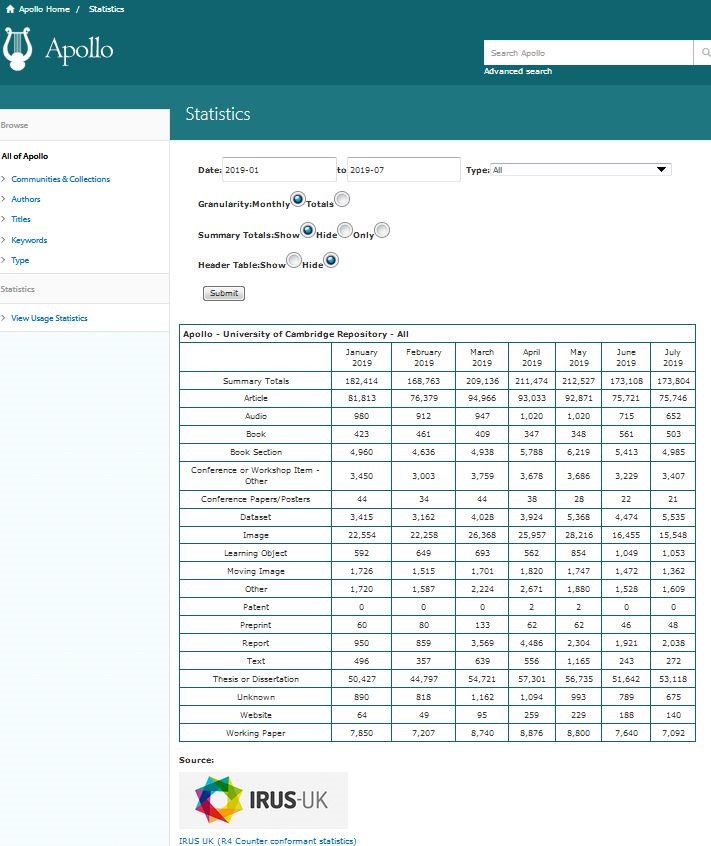
The University of Cambridge has already embedded the widget into its Apollo – University of Cambridge Repository. https://www.repository.cam.ac.uk/statistics-home
Example of how their data is displayed by item type and by month:
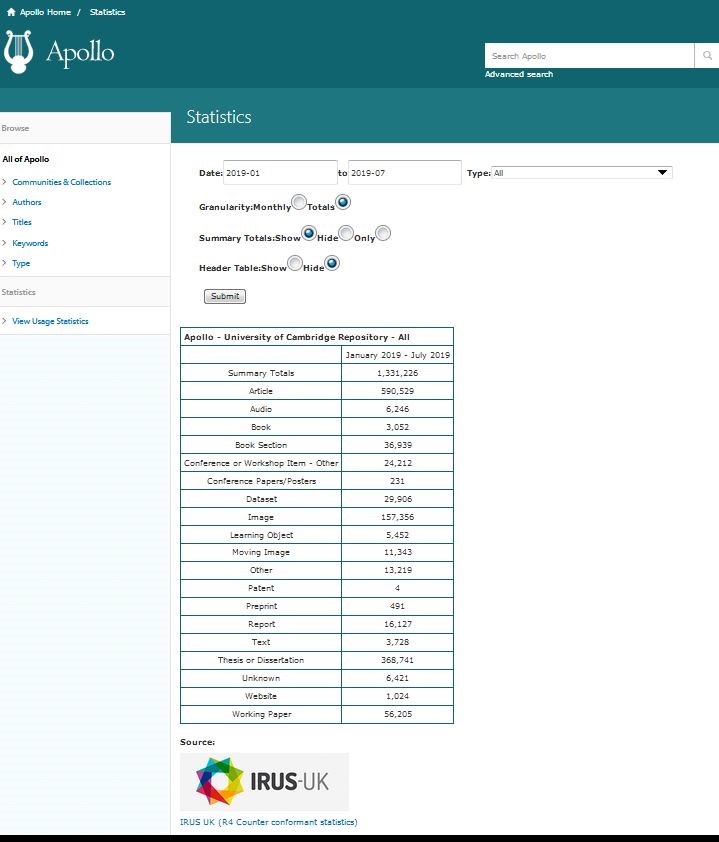
Example of how their data is displayed by totals during the selected period:
How to embed the IRUS-UK widget
On the IRUS-UK widget page, https://irus.jisc.ac.uk/support/widget/ are details about it, along with the code and an explanation of how to embed it into an IR web page, as well as how to style the widget to suit any repository requirements.
Future plans
We recognise that there is a requirement to display data down to item level statistics, in addition to these summary level statistics. We aim to introduce such a facility this year to support repositories that are most interested in a way to incorporate the IRUS-UK usage data for each of the records in their repository and integrate it into the user’s view of that record.
If you have any questions, comments or requests for additional developments then please contact us via the helpdesk: help@jisc.ac.uk and mention IRUS or IRUS-UK in the subject.